Data Dashboard Projects
Explore real-world dashboards I've created using Python, Streamlit, and Tableau. Each project focuses on turning raw data into actionable business insights across finance, retail, and sustainability.
Stock Portfolio Analysis
A dynamic Streamlit dashboard to monitor your investment portfolio globally and per asset. Track real-time stock prices, performance, and progress toward financial goals.
Built with: Python · Streamlit · yFinance
View live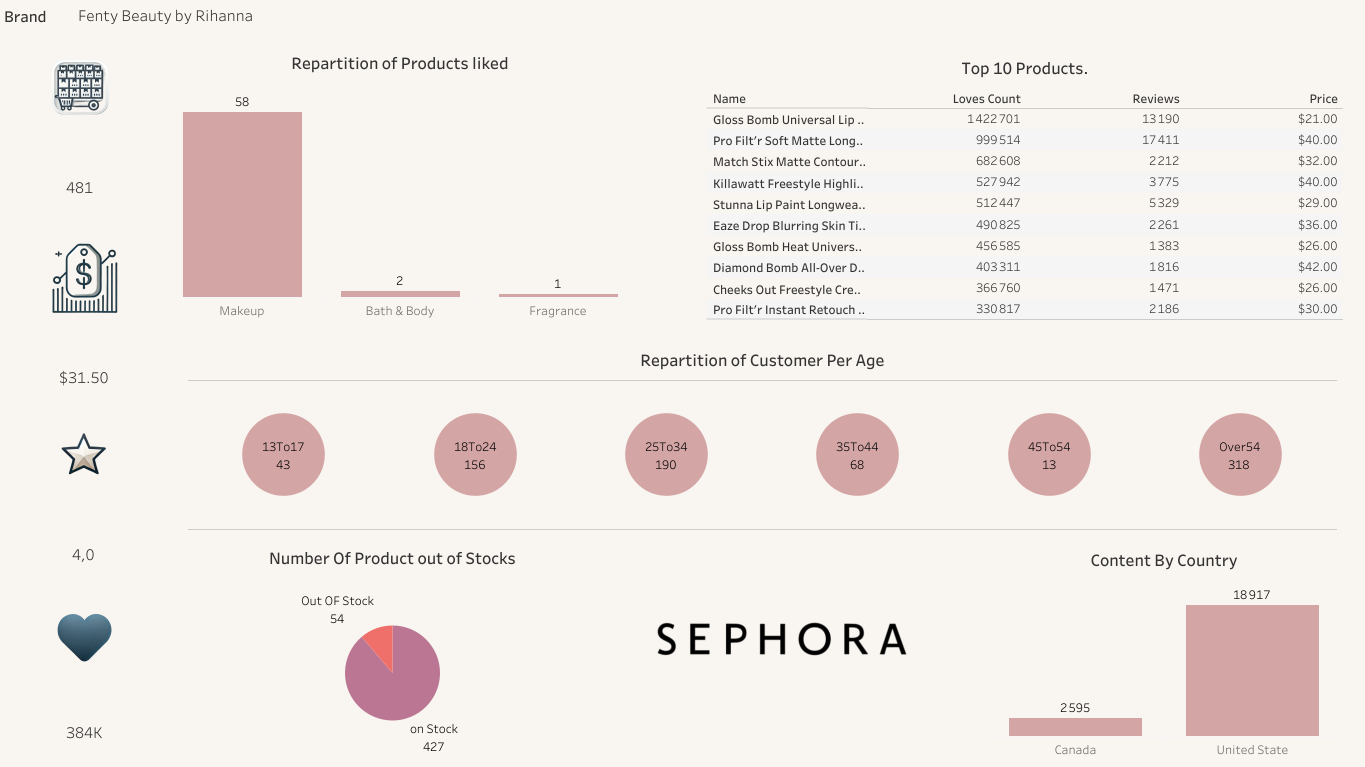
Product & Brand Analytics
A Tableau dashboard analyzing all Sephora brands. It includes customer segmentation by age group, top-performing products, average prices, and stock availability.
Built with: Tableau
View Dashboard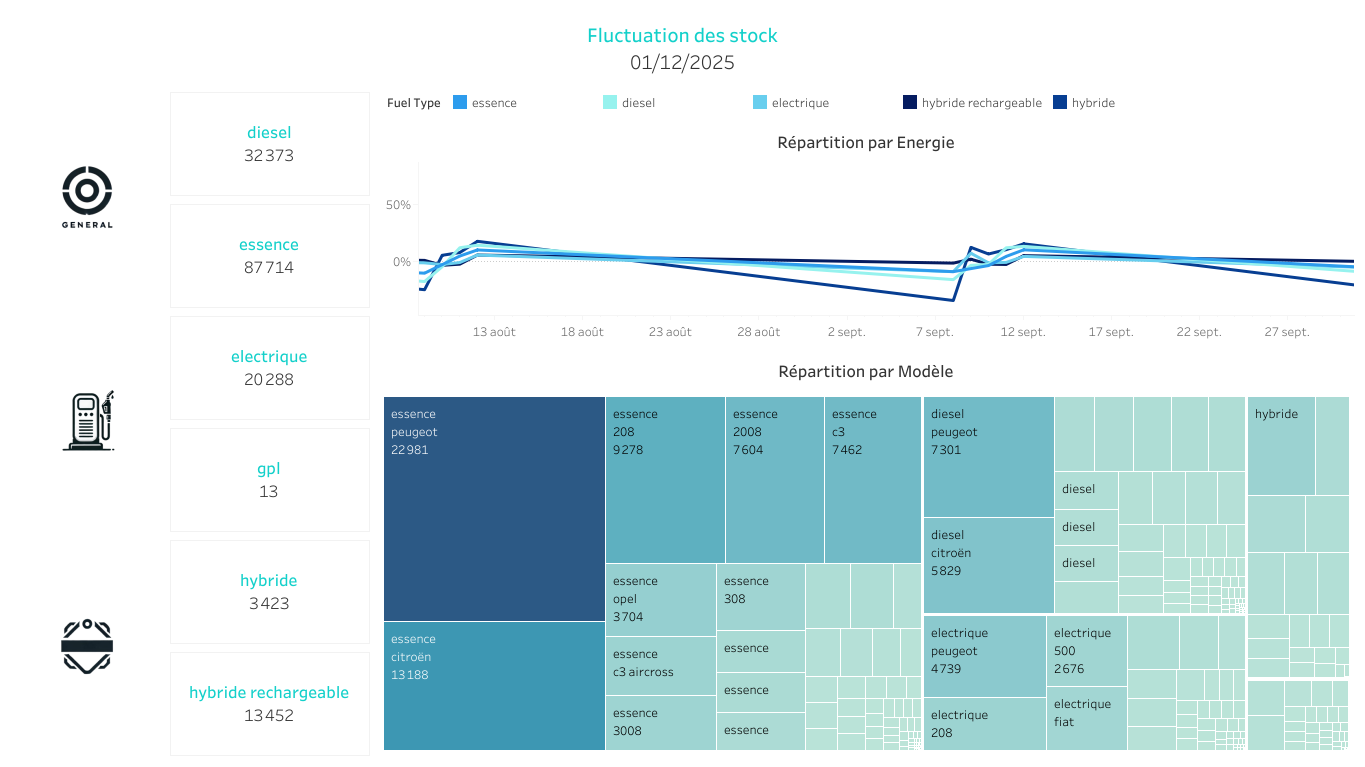
Fleet & Energy Insights
This 3-part Tableau dashboard visualizes vehicle availability by brand, fuel type (gasoline, electric, hybrid), and stock trends over time. Perfect for energy transition and supply analysis.
Built with: Tableau
View Dashboard