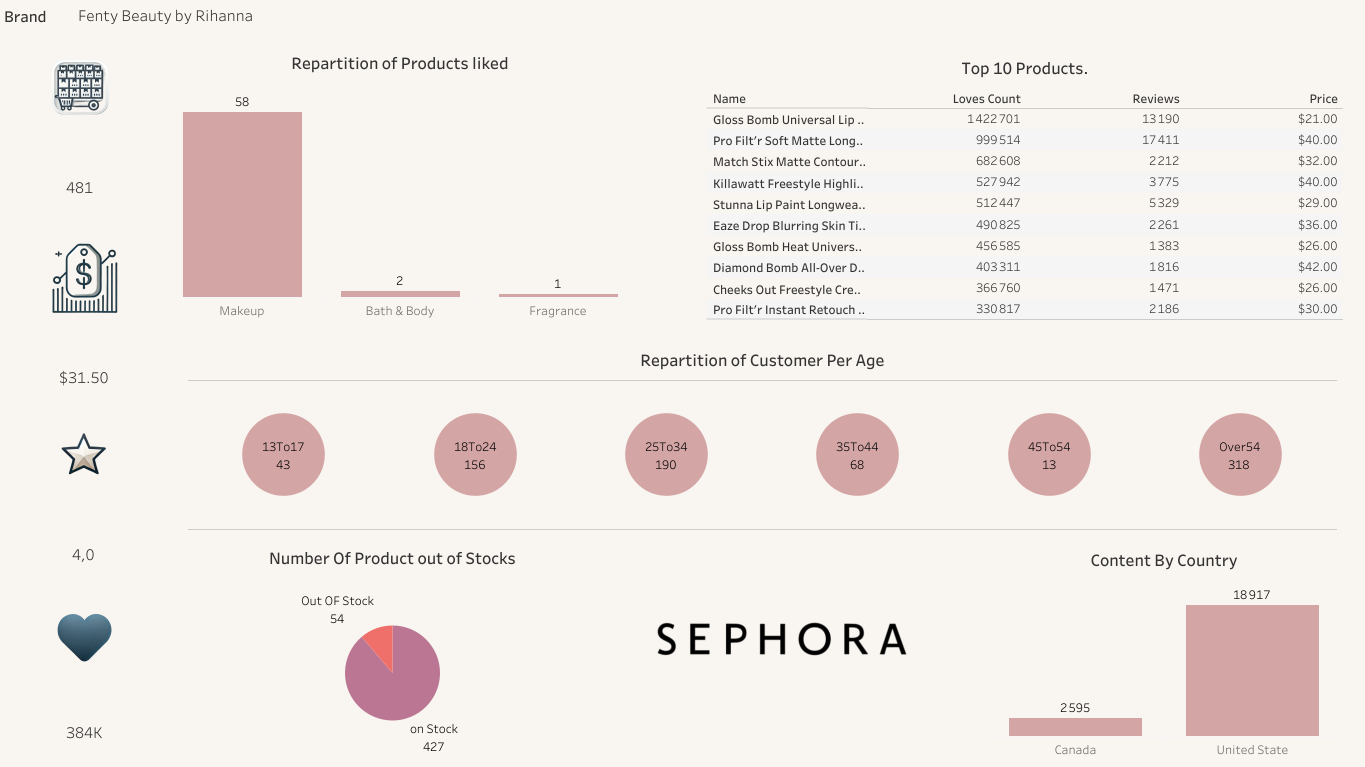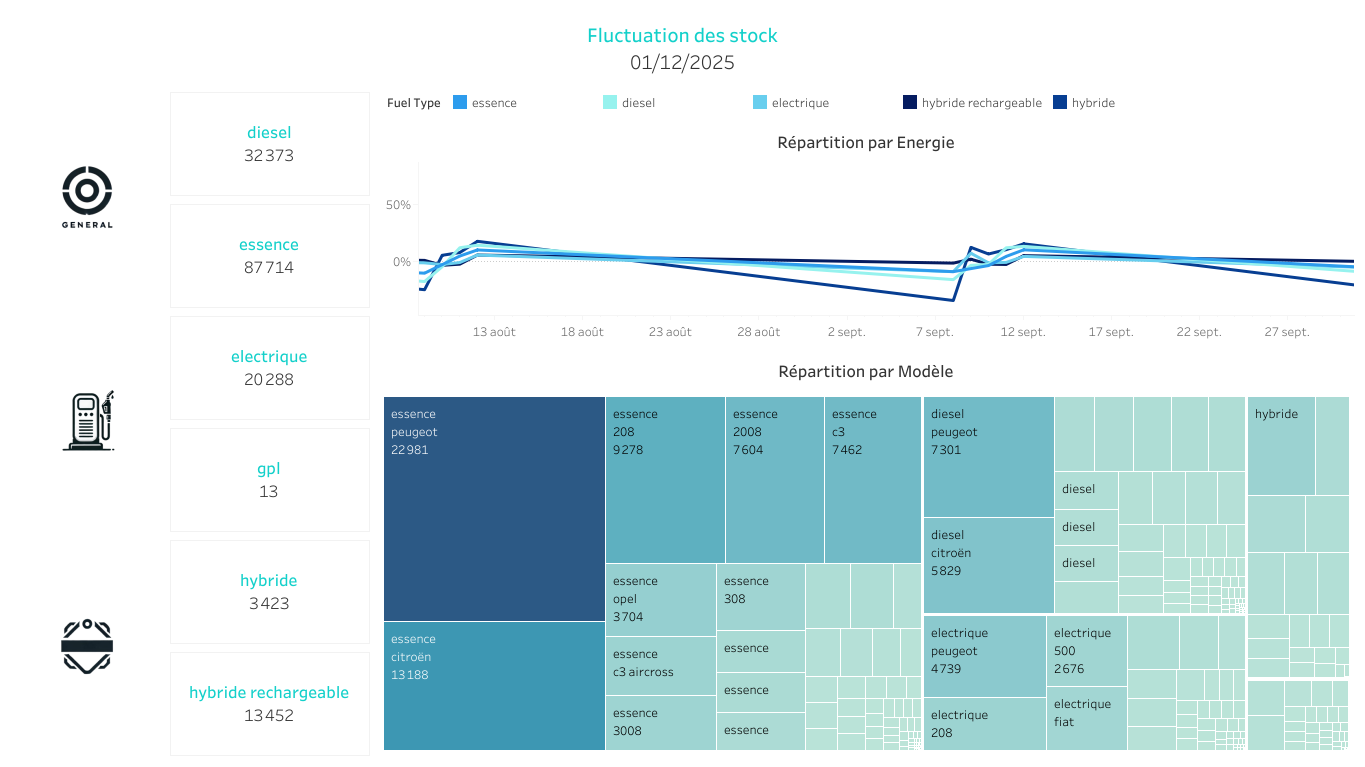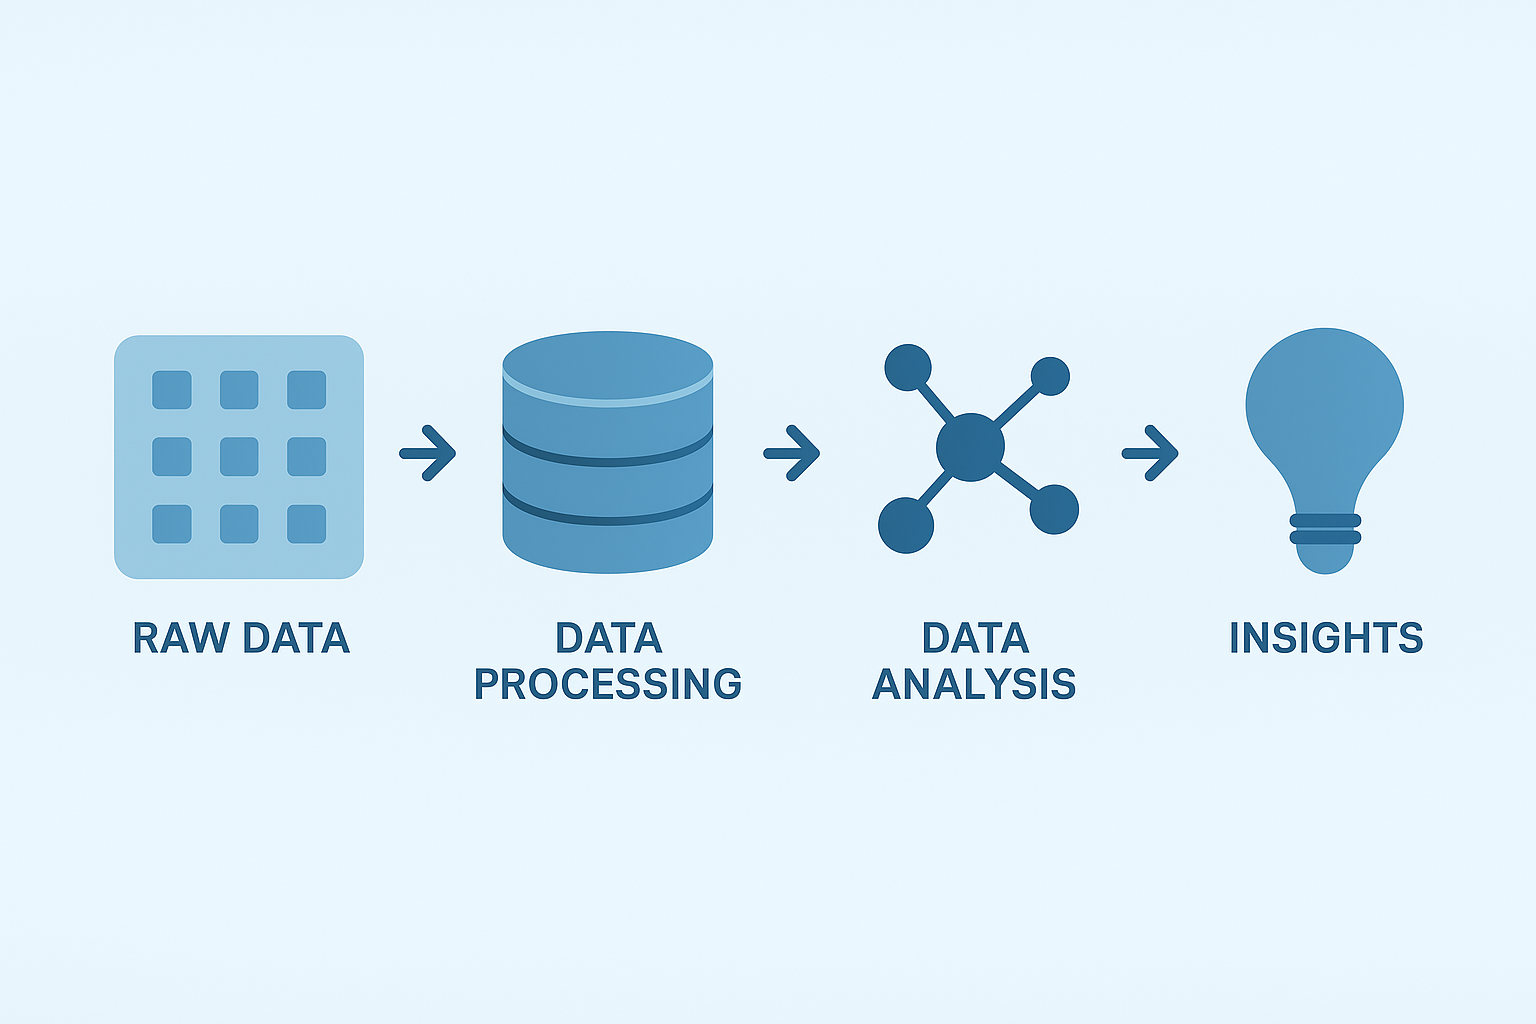


Discover a collection of data dashboards built with Power BI, Tableau, and Python Streamlit, tailored for business intelligence, financial analysis, and data storytelling. Each dashboard is designed to turn complex data into actionable insights.
I'm Jathur, a data consultant passionate about creating impactful dashboards using Power BI, Tableau, and Python. I help businesses unlock insights and make data-driven decisions.
Learn more →
This financial dashboard analyzes PayPal Holdings, Inc., highlighting stock price evolution, sector classification, portfolio weight (82.69%), and a return of +11.2%. Visuals include a dynamic line chart and bar comparison between invested capital and current value. Built using Python and Streamlit, this tool helps track investment goals and financial performance in real time.
View Dashboard View all dashboards